Mastering Data Analysis with MATLAB: A Comprehensive Guide

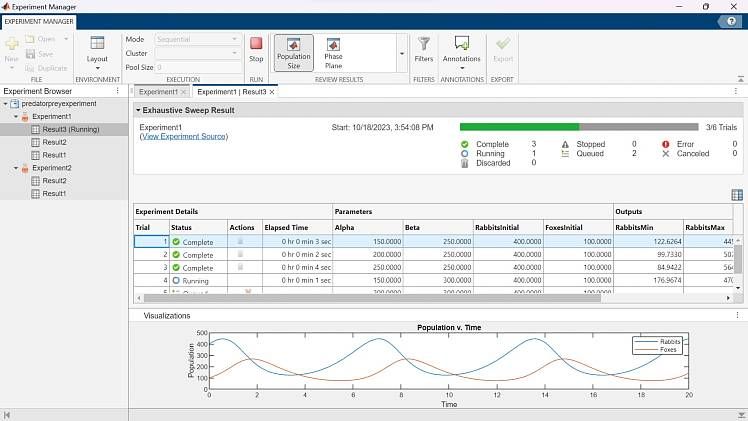
Introduction: MATLAB, short for Matrix Laboratory, is a powerful computing environment and programming language widely used in various fields, including engineering, science, finance, and data analysis. Its rich set of built-in functions and toolboxes make it an ideal choice for processing, analyzing, and visualizing large datasets. In this comprehensive guide, we’ll explore how to harness the capabilities of MATLAB for data analysis, covering everything from importing data to performing advanced statistical analysis and visualization.
Step 1: Installing MATLAB and Getting Started Before diving into data analysis with MATLAB, you’ll need to install the software on your computer. MATLAB is available for Windows, macOS, and Linux operating systems, and can be downloaded from the MathWorks website. Once installed, launch MATLAB to begin your data analysis journey. Familiarize yourself with the MATLAB interface, including the Command Window, Workspace, and Editor, where you’ll write and execute MATLAB code.
Step 2: Importing Data The first step in any data analysis project is importing the data into MATLAB. MATLAB supports various file formats, including CSV, Excel, HDF5, and MAT files, making it easy to work with data from different sources. You can use functions like readtable, csvread, or load to import tabular data, matrices, or structured datasets into MATLAB’s workspace. Additionally, MATLAB provides graphical tools for importing and exploring data interactively, such as the Import Tool and Data Import Wizard.
Step 3: Data Cleaning and Preprocessing Once your data is imported into MATLAB, it’s essential to clean and preprocess it before analysis. This may involve handling missing values, removing outliers, normalizing data, or transforming variables. MATLAB offers a wide range of functions and techniques for data cleaning and preprocessing, including interpolation, filtering, and feature scaling. You can also automate data preprocessing tasks using MATLAB scripts or functions to streamline your workflow.
Step 4: Exploratory Data Analysis (EDA) Exploratory Data Analysis (EDA) is a crucial step in understanding the characteristics and patterns present in your data. MATLAB provides powerful tools for visualizing data and exploring relationships between variables. You can create histograms, scatter plots, box plots, and heatmaps using MATLAB’s plotting functions like histogram, scatter, boxplot, and heatmap. Additionally, MATLAB’s Statistics and Machine Learning Toolbox offers functions for calculating summary statistics, correlation coefficients, and frequency distributions to gain insights into your data.
Step 5: Statistical Analysis Once you’ve explored your data visually, you can perform a wide range of statistical analyses using MATLAB. Whether you’re conducting hypothesis testing, regression analysis, or clustering, MATLAB’s built-in functions and toolboxes have you covered. MATLAB’s Statistics Toolbox provides functions for performing t-tests, ANOVA, chi-square tests, and more. You can also fit linear and nonlinear regression models, conduct time series analysis, and perform multivariate statistical analysis using MATLAB’s extensive library of functions.
Step 6: Machine Learning and Predictive Modeling In addition to traditional statistical analysis, MATLAB enables you to leverage the power of machine learning for predictive modeling and classification tasks. MATLAB’s Machine Learning Toolbox provides algorithms for supervised and unsupervised learning, including decision trees, support vector machines, neural networks, and ensemble methods. You can train machine learning models using labeled data and evaluate their performance using cross-validation techniques. MATLAB’s intuitive syntax and interactive tools make it easy to experiment with different algorithms and hyperparameters to find the best model for your data.
Step 7: Advanced Visualization Visualization is a key aspect of data analysis, helping to communicate insights and findings effectively. MATLAB offers a wealth of options for creating advanced visualizations and customizing plot aesthetics. You can create interactive plots, 3D visualizations, and animations using MATLAB’s plotting functions and graphics capabilities. MATLAB also supports the creation of publication-quality figures for presentations and reports, with options for customizing fonts, colors, and annotations.
Step 8: Documenting and Sharing Results Once you’ve completed your data analysis in MATLAB, it’s important to document your findings and share them with others. MATLAB provides tools for generating reports, including formatted text, code, and visualizations, using the Live Editor. You can create interactive documents that combine explanatory text, MATLAB code, and output, making it easy to reproduce your analysis and share it with colleagues or collaborators. MATLAB also supports the creation of standalone applications and web apps for deploying data analysis solutions to end-users.
Conclusion: MATLAB is a versatile tool for data analysis, offering a comprehensive suite of features and capabilities for processing, exploring, and visualizing data. By following the steps outlined in this guide, you can leverage MATLAB’s powerful functionality to gain insights from your data, perform statistical analysis, and build predictive models. Whether you’re a beginner or an experienced data analyst, MATLAB provides the tools you need to tackle complex data analysis tasks and drive informed decision-making. With practice and experimentation, you can become proficient in using MATLAB for data analysis and unlock its full potential for solving real-world problems.


