Unveiling the Evolution: A Comprehensive Comparison of Excel 2007, 2013, and 2021
Microsoft Excel, a cornerstone of the Office suite, has undergone significant transformations over the years, introducing new features and functionalities with each version. In this extensive exploration, we’ll delve into the evolution of Excel by comparing the features of Excel 2007, Excel 2013, and the latest iteration, Excel 2021. From interface enhancements to data analysis tools, we’ll navigate through the key aspects that define each version of Excel, providing users with a comprehensive understanding of the evolution and capabilities of this powerful spreadsheet software.
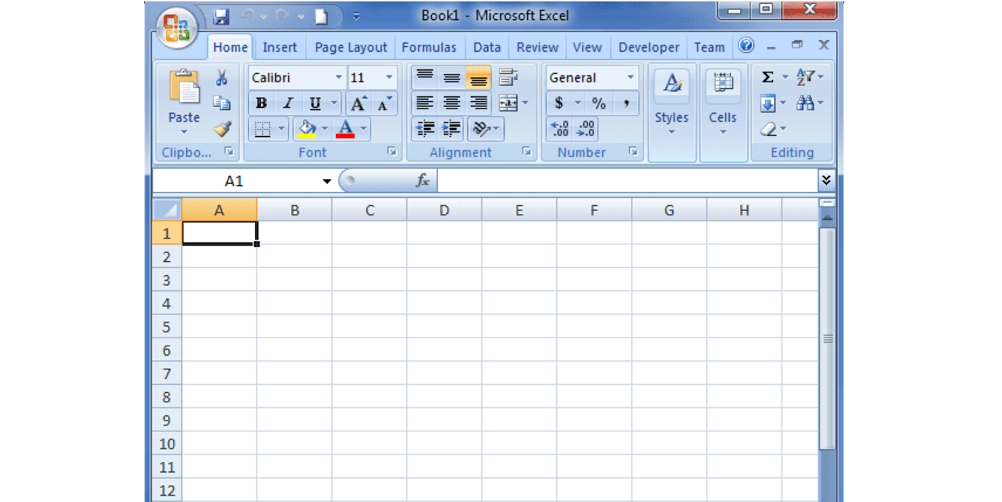
Excel 2007: A Paradigm Shift in Interface and Functionality
1. Ribbon Interface Debut:
Excel 2007 marked a revolutionary departure from its predecessors by introducing the Ribbon Interface. The traditional menu and toolbar system were replaced with a dynamic ribbon containing tabs and groups, streamlining access to commands and tools. This shift aimed to enhance user efficiency and reduce the learning curve associated with Excel.
2. Cell Styles and Themes:
Excel 2007 introduced a more visually appealing approach to spreadsheet design with the addition of cell styles and themes. Users could easily apply predefined styles to cells, providing a consistent and polished look to their worksheets. Themes allowed for quick changes to color schemes and fonts across the entire workbook.
3. Conditional Formatting Improvements:
Building on the concept of conditional formatting, Excel 2007 expanded the repertoire of formatting rules. Users could now apply more nuanced formatting based on cell values, making it easier to visualize data trends and anomalies.
4. Enhanced Formula Bar:
The Formula Bar received a facelift in Excel 2007, providing a more user-friendly interface for entering and editing formulas. It displayed a color-coded formula, making it easier to distinguish between cell references and operators.
5. Data Visualization with Sparklines:
Excel 2007 introduced Sparklines, small in-cell charts that offered a quick visual representation of data trends. This feature empowered users to embed miniature charts within cells, enhancing the analytical capabilities of Excel.
Excel 2013: A Symphony of Productivity and Collaboration
1. Quick Analysis Tool:
Excel 2013 elevated data analysis with the introduction of the Quick Analysis Tool. This feature provided a streamlined way to analyze and visualize data trends, offering quick insights and formatting options directly from the selected data.
2. Flash Fill for Data Transformation:
Streamlining data transformation tasks, Excel 2013 introduced Flash Fill. This intelligent feature could automatically recognize patterns in data entry and complete repetitive tasks with a simple click, saving time and reducing manual effort.
3. Power View for Interactive Data Exploration:
Excel 2013 embraced interactive data exploration with Power View. This feature allowed users to create interactive data visualizations, dashboards, and reports, fostering a more dynamic and engaging approach to data analysis.
4. New Chart Types:
Excel 2013 expanded its charting capabilities by introducing new chart types, including TreeMap, Sunburst, and Histogram. These additions enriched the visualization options, providing users with more tools to effectively communicate their data.
5. Improved PivotTable Functionality:
Building on the power of PivotTables, Excel 2013 introduced features like Recommended PivotTables, making it easier for users to create insightful data summaries. Slicers also gained enhancements, offering more control over filtering and analyzing data within PivotTables.
6. In-App Collaboration with Comments:
Excel 2013 streamlined collaboration with in-app comments. Users could leave comments on specific cells, making it convenient for collaborators to provide feedback and engage in discussions directly within the spreadsheet.
Excel 2021: Innovations in Efficiency and Cloud Integration
1. Dynamic Arrays and Spill Ranges:
Excel 2021 introduced a game-changing feature with Dynamic Arrays and Spill Ranges. This innovation allowed formulas to spill over multiple cells dynamically, eliminating the need for array formulas and simplifying complex calculations.
2. XLOOKUP Function:
Replacing the traditional VLOOKUP function, Excel 2021 introduced XLOOKUP. This function offered enhanced flexibility, allowing users to perform exact matches, partial matches, and search in any direction, revolutionizing the way data lookup is conducted.
3. LET Function for Formula Optimization:
Excel 2021 introduced the LET function, providing users with a more efficient way to manage complex formulas. By assigning names to intermediate steps within a formula, the LET function enhanced formula readability and maintainability.
4. Integration with Microsoft 365 and Cloud Services:
Excel 2021 embraced the era of cloud computing by seamlessly integrating with Microsoft 365 and cloud services. This integration facilitated collaborative work, allowing users to access and edit Excel files across devices while leveraging the power of cloud storage.
5. Enhancements in Power Query:
Building on the capabilities of Power Query, Excel 2021 introduced new transformations and enhancements. Users could now perform operations like group by, pivot columns, and extract values with greater ease, streamlining the data preparation process.
6. AI-Powered Features:
Excel 2021 leveraged the power of artificial intelligence with features like Ideas and Smart Data Types. Ideas provided intelligent insights and suggestions based on the data, while Smart Data Types recognized and linked data to external sources for enriched information.
Common Features Across Versions:
a. Excel Online:
Microsoft’s commitment to cloud computing is evident in all three versions. Excel Online allows users to access and edit their Excel files through a web browser, fostering collaboration and ensuring accessibility from any device.
b. Formula Autocomplete:
The formula autocomplete feature has been a consistent presence across all versions. It aids users in entering formulas by suggesting function and cell references, improving accuracy and efficiency.
c. Data Validation:
Excel’s data validation feature, ensuring data accuracy and consistency, has been a constant throughout the versions. Users can define rules and restrictions for cell entries, promoting data integrity.
d. Charting Tools:
Charting tools have evolved across versions, offering users a diverse range of options to visualize data. While new chart types were introduced in Excel 2013 and 2021, the fundamental charting tools have remained a core feature.
e. PivotTables and PivotCharts:
PivotTables and PivotCharts have been fundamental to Excel’s data analysis capabilities. All three versions have enhanced and refined these features, providing users with powerful tools for summarizing and exploring data.
Conclusion: Excel’s Evolutionary Journey
As we traverse the evolutionary journey of Microsoft Excel from 2007 to 2021, it becomes evident that each version brought unique features and enhancements, catering to the evolving needs of users. From the paradigm shift in interface design in Excel 2007 to the cloud-integrated, AI-powered features of Excel 2021, the spreadsheet software has evolved into a dynamic and indispensable tool for individuals and organizations alike.
Whether you’re a seasoned Excel user or just embarking on your spreadsheet journey, understanding the features of each version provides valuable insights into the capabilities at your disposal. As technology continues to advance, Excel remains at the forefront of innovation, empowering users to analyze data, make informed decisions, and unleash the full potential of their numerical and analytical endeavors. So, whether you’re crunching numbers, creating insightful visualizations, or collaborating in the cloud, Excel’s evolutionary journey ensures that you have a powerful ally in your quest for data mastery.