Beyond Task Manager: Using Resource Monitor to Identify Invisible Disk Write Bottlenecks
Beyond Task Manager: Using Resource Monitor to Identify Invisible Disk Write Bottlenecks
In order to troubleshoot performance difficulties, the majority of Windows users depend on Task Manager. This is particularly true in situations when the system becomes sluggish, unresponsive, or excessively loud during times of inactivity. Despite the fact that Task Manager offers a high-level overview of the use of the CPU, RAM, disk, and network, it often conceals deeper system-level activity that leads to a decline in performance. Invisible disk write bottlenecks are one of the most often neglected problems. These are circumstances in which the disk seems to be minimally utilized in Task Manager, but the system is continuously conducting tiny, fragmented, or background write operations. Although each of these actions may not seem particularly important on its own, when taken together they have the potential to create prolonged slowdowns, increased wear on storage devices, and delayed system responsiveness for the system. Users are able to determine precisely which programs, files, and services are causing hidden write pressure by using Windows Resource Monitor, which provides a far more thorough picture of disk activity. Having a solid understanding of how to make efficient use of this tool is very necessary in order to diagnose sophisticated storage performance issues that Task Manager is unable to show.
Gaining an Understanding of the Limitations of Disk Metrics Utilising Task Manager
In order to simplify the process of seeing disk activity, Task Manager mainly concentrates on the percentage of overall usage and the basic read/write throughput. Despite the fact that this is helpful for overall monitoring, it does not provide granular data such as specific file access patterns, queued activities, or the behavior of disks at the process level over time. As a consequence of this, brief periods of high-frequency write activity may give the impression of being typical use, despite the fact that they have a major influence on the performance of the system. It is possible for background processes to make continual low-level disk writes that are not visible at this summary level. Some examples of these activities are indexing services, telemetry, update agents, and application caches. Without a more in-depth investigation, these difficulties are often misunderstood as problems with the central processing unit (CPU) or memory rather than storage limitations.
That Which Causes Bottlenecks in Disk Write to Be “Invisible”
Constant tiny write operations that do not produce evident spikes in Task Manager are the cause of invisible disk write bottlenecks. These bottlenecks emerge when the system encounters these activities. It is possible that these writes will entail updating the logs, clearing the cache, synchronizing the metadata, or doing background database maintenance. The effective management of input/output (I/O) by current storage systems results in the distribution of these activities throughout time, which may not give the impression of continuous high consumption. The cumulative impact, on the other hand, results in delay, particularly on conventional hard drives or solid-state drives that are extensively fragmented. These bottlenecks are especially troublesome because they often occur during times of idleness. This gives the appearance that the system is not being loaded, but in reality, performance is still being degraded in the background.
Discovering Hidden Disk Activity Through the Use of Resource Monitor Software
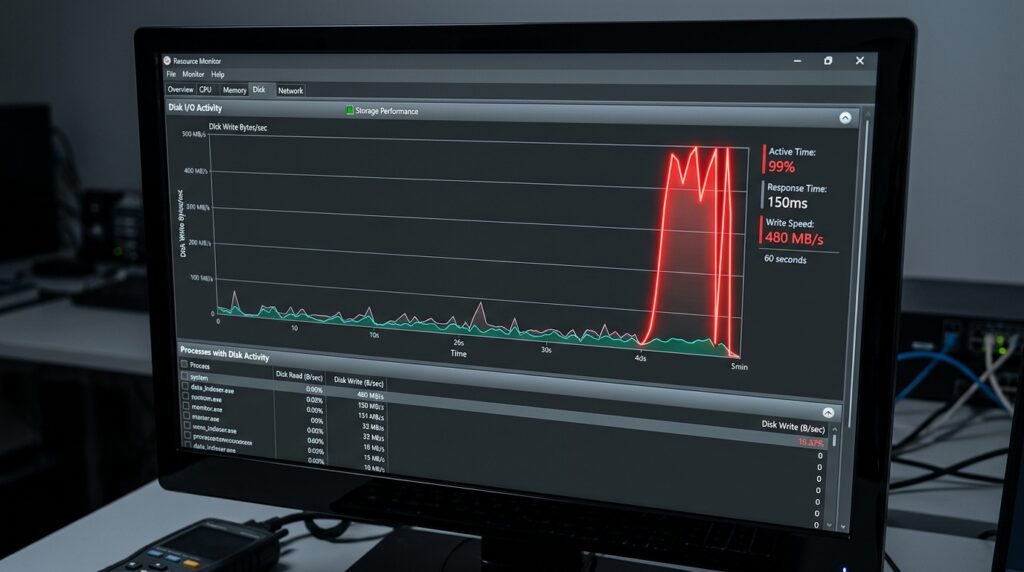
Through the process of breaking down disk consumption at the process and file level, Resource Monitor offers a more complete and accurate picture of the activity that is taking place on the system. Unlike Task Manager, it shows the read and write operations that are taking place in real time for each process that is currently executing, as well as the individual files that are being accessed. Users will be able to determine precisely which apps are responsible for the continual activity on the disk that they are experiencing. Due to the fact that the Disk tab in Resource Monitor displays active file handles, response times, and queue lengths, it is feasible to identify inefficiencies that would otherwise stay hidden. Through the analysis of this data, users are able to identify background programs that are responsible for unwanted disk writes and then take the required steps to rectify the situation.
Determining the Processes That Are Responsible for Continuous Writing Activity
It is one of the most useful capabilities of Resource Monitor to be able to identify processes that engage in a significant amount of persistent writing. Services provided by the system, apps provided by other parties, and systems for background updates that continually write data to disk are examples of these. Search indexing services, cloud synchronization tools, antivirus scanners, and telemetry collectors are some examples of common instances. Although these procedures are often legal, they have the potential to become problematic if they are carried out in an inefficient manner or with an excessive frequency. Through the use of Resource Monitor, users are able to organize processes according to their write activity, which makes it simpler to recognize patterns of excessive disk utilization. Having identified these processes, it is possible to regulate, limit, or optimize them in order to decrease burden that is not essential.
Evaluating the Length of the Disk Queue and the Response Time
The length of the disk queue is an important measure that represents the number of read and write operations that are holding out for the storage device to perform them. If the queue length is continually large, it indicates that the disk is having difficulty keeping up with the number of requests that are coming in, even if the total use seems to be low. Measurements of response time provide further insight into the speed at which the disk is able to do these activities. The presence of high response times in conjunction with low apparent usage is often indicative of hidden bottlenecks that are brought about by fragmented writes or ineffective background activities. Users are able to discover performance deterioration that is not obvious in Task Manager because to Resource Monitor’s ability to give real-time display of these data.
Identification of Write Hotspots at the File Level
Additionally, Resource Monitor shows disk activity at the file level, revealing the specific files that are being updated or written to. It is very necessary to have this level of specificity in order to identify the exact causes of persistent disk activity. Examples of files that may undergo constant updates without the user’s knowledge include log files, cache databases, and temporary system files. The identification of these hotspots enables users to assess if the activity in question is required, or whether it is possible to eliminate or reroute it. Misconfigured apps might cause extra load on the disk by repeatedly writing to the same file. This can happen under certain circumstances. To successfully resolve these inefficiencies, it is essential to have a solid understanding of the behavior at the file level.
Identification of Disk Writes That Are Normal and Those That Are Problematic
Disk write activity is not always bad, and it is vital to differentiate between typical system behavior and bottlenecks that cause problems. In order to execute updates, security logging, and cache management, operating systems routinely carry out background writes. On the other hand, inefficiencies are often indicated by excessive frequency, long wait times, or activity that endures for an extended period of time. Through the provision of continuous real-time data, Resource Monitor becomes an invaluable tool for distinguishing these trends. In contrast to problematic behavior, which is characterized by continuous and repeated conduct, normal activity tends to occur in brief bursts. In order to guarantee that users do not deactivate key system functionalities while yet successfully resolving performance concerns, it is important to recognize these variations.
Performance Optimization of the System Based on Insights Obtained from Resource Monitors
Immediately after the identification of disc activity that is troublesome, remedial steps may be made in order to lessen the burden on the system. In order to do this, it may be required to make adjustments to the settings of the program, disable any superfluous background services, or move expensive write activities to storage devices that are quicker. When it comes to performance, there are some circumstances in which lowering synchronization frequency or decreasing the indexing scope might result in considerable improvements. Defragmentation (for hard disk drives) and TRIM maintenance (for solid-state drives) are two examples of storage optimization methods that may assist minimize delay associated with fragmented writing. Users have the ability to implement targeted improvements that directly address the fundamental cause of disk bottlenecks by utilizing the information received by Resource Monitor.
Maintaining the Consistency of Disk Performance Over the Long Term
Continuous monitoring and knowledge of the system are required in order to identify and eliminate invisible disk write bottlenecks. Performing regular reviews of the data from Resource Monitor helps uncover potential problems before they have a substantial influence on performance. Keeping software up to date, eliminating background apps that are not essential, and keeping storage structures structured are all factors that contribute to consistent performance over the long run. Actively monitored and improved systems have a tendency to demonstrate less performance swings and more constant responsiveness over the course of time. By going beyond Task Manager and making appropriate use of Resource Monitor, users are able to get a more in-depth awareness of the behavior of the system and sustain better disk performance over long periods of time.